Insight:
- US container import volume surged in July 2024, reaching 2,556,180 TEUs.
- Despite the increased volume, port transit times remained relatively unchanged.
According to the Global Port Tracker, a monthly report produced by the NRF and consulting firm Hackett Associates, major U.S. ports handled 2.08 million TEUs of imports in May, a 3% increase from April and a 7.5% increase compared to May 2022. The May figure also marked the highest since August 2022.
This is the first time in 22 months (about 2 years) that volumes have exceeded 2.4 million TEUs, a level that caused significant port congestion and delays during the pandemic years. Compared to July 2023, TEU import volumes increased 16.8% year-over-year and 16.3% compared to July 2019, before the pandemic. Import volume growth for the first seven months of 2024 is 15.6% higher than the same period in 2019.
Background of US container import
Shipping costs have increased
In early 2024, the global and US import landscape exhibited concerning signs. Ocean freight rates for containers bound for Europe and the US have surged significantly due to port congestion at several Asian ports, creating pricing challenges for shipping companies.
According to Drewry, an independent maritime research center, container freight rates on Asia-Europe and Asia-US routes have seen the most substantial increases. Container freight rates from Asia to the US and Europe have tripled since the beginning of 2024. Xeneta, a freight rate benchmarking platform, reported that rates from Asia and Singapore to the US East Coast are at their highest levels since September 2022, while rates to the US West Coast are at their highest since August 2022.
Some industry experts attribute part of the congestion at Chinese ports to US importers rushing to procure goods such as steel and medical products ahead of significant tariff increases scheduled for August 1st. Contributing factors to freight rate volatility include the conflict in the Red Sea, forcing vessels to take the longer route around the Cape of Good Hope, adding 9-14 days to voyages. Additionally, localized congestion at the Port of Singapore has resulted in vessel waiting times.
Shortage of empty containers
Beyond the significant surge in freight rates, the shortage of empty containers has emerged as a major challenge for the import-export industry, significantly impacting global trade. Indian exporters to North America and Europe have complained of waiting up to three weeks to secure a shipping container.
Currently, the Chinese market is experiencing a high demand for empty containers to support exports to the US ahead of the August 1st tariff deadline, leading shipping lines to divert empty containers to China. This could disrupt the balance of empty container supply but is expected to be temporary. The root cause of the container shortage can be attributed to the disruptions caused by the pandemic to global supply chains.
Consequently, shipping costs have escalated, contributing to higher consumer prices. As global supply chains have recovered, new challenges have emerged such as port congestion and vessel slow steaming due to port bottlenecks. In March, a 20,000 TEU container ship became stranded in the Suez Canal, further exacerbating the shortage. However, the container shortage is projected to ease and improve in the future.
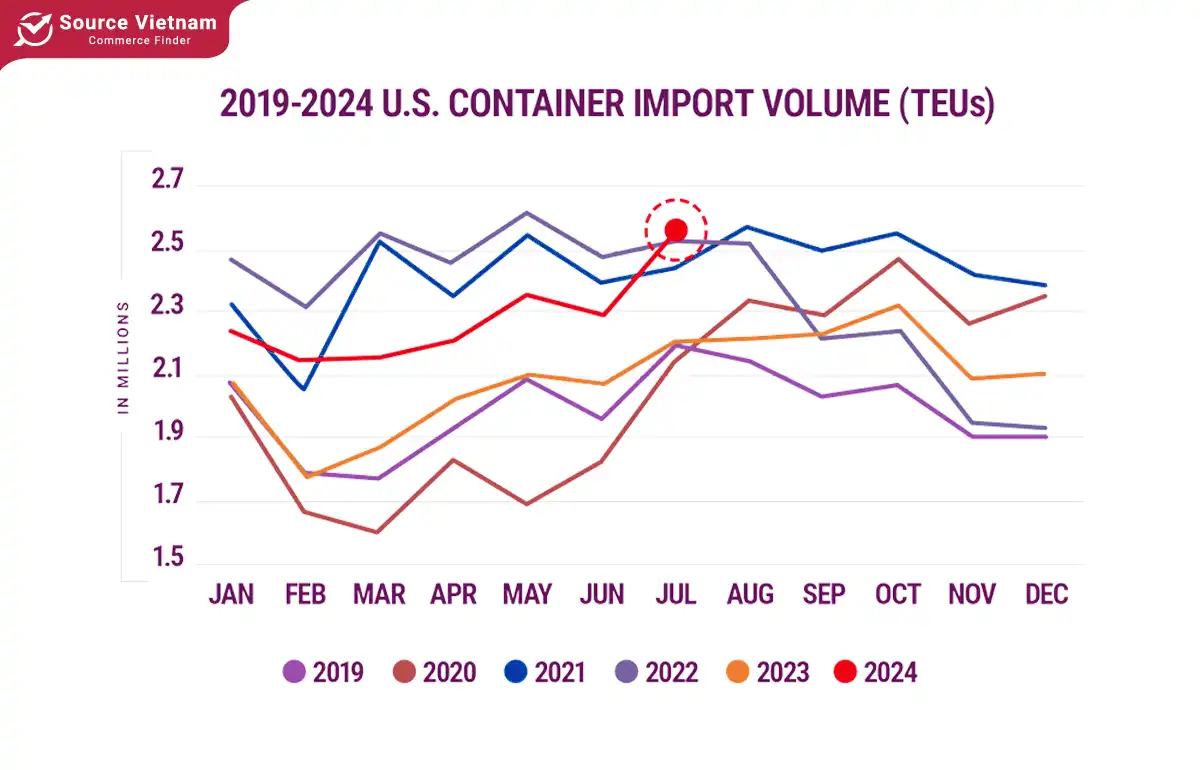
Container imports to the US have hit an all-time high
Container imports have seen robust growth in 2024. As of July 2024, the volume of imported containers reached the third highest level in history at 2,556,180 TEU (twenty-foot equivalent units). This figure is only surpassed by the two peak months of May 2022 (2,622,465 TEU) and March 2022 (2,558,021 TEU). Despite the increased volume in July, shipping times remained relatively stable with no significant fluctuations.
July 2024’s volume represents an 11.2% increase compared to June 2024, aligning with typical growth patterns in non-pandemic years. According to the report, US imports from China hit a record high in July at 1,022,913 TEU, surpassing the previous record set in August 2022 of 1,003,725 TEU.
Imports from China increased by 14.7% in July compared to June and by 19.9% compared to July 2023. Additionally, imports from China accounted for 40% of total US container imports in July, an increase of 1.2% from June but still 1.5% below the peak of 41.5% in February 2022.
Despite the strong volume, global supply chain disruptions are still expected to continue in the second half of the year due to ongoing geopolitical tensions and complexities. Furthermore, various other factors may contribute to supply chain volatility.
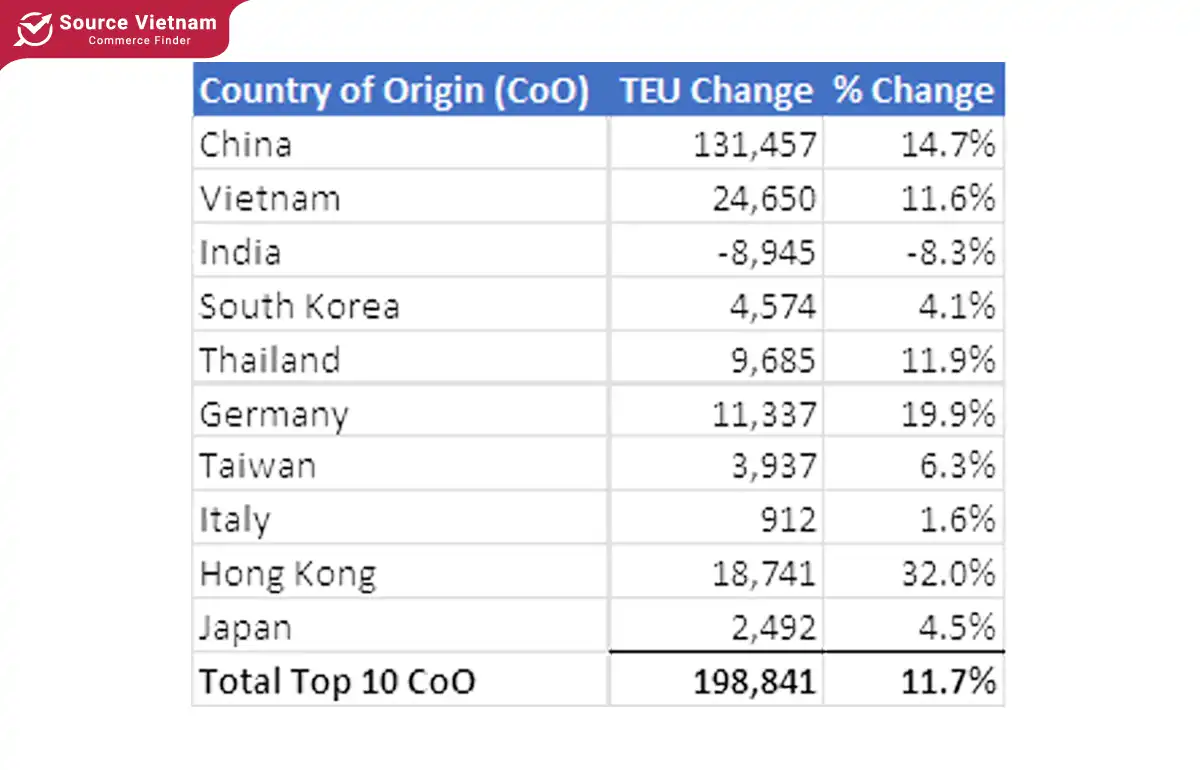
The report indicates that US container imports remained relatively stable in July compared to earlier months. China maintained its position as the top exporter to the US. Notably, China, Vietnam, and Hong Kong experienced the largest import growth, increasing by 131,457 TEU, 24,650 TEU, and 18,741 TEU, respectively, over the previous period. Conversely, imports from India declined most significantly, dropping by 8,945 TEU.
Reasons for the increase in container imports
The increase in container imports to the United States in 2024 is likely the result of a complex interplay of various factors, with several notable causes.
Domestic consumption demand recovers
Following the pandemic and social distancing measures, American consumer demand has rebounded. This has led businesses to increase imports to meet market demand. Additionally, government stimulus programs have boosted household incomes, further stimulating consumption and imports.
Related News


Some geopolitical tensions and supply chain disruptions
Trade tensions between the U.S. and major trading partners like China may lead U.S. businesses to diversify their supply chains, seeking new suppliers in other countries, thereby increasing imports. Unexpected events such as geopolitical conflicts, natural disasters, or logistical issues can disrupt global supply chains, prompting U.S. businesses to stockpile more goods, leading to higher import volumes.
Moreover, retailers are concerned about a potential strike on October 1st at ports from Maine to Texas following stalled negotiations between the International Longshore and Warehouse Union and the U.S. Maritime Alliance. Shipping giant Maersk warned on August 9th of potential consequences if a U.S. port strike disrupts cargo transportation.
Inflation and inflationary expectations
As inflationary pressures mount, both businesses and consumers are adopting strategic measures to mitigate the impact of rising prices. Enterprises are proactively bolstering their inventory levels through increased imports to safeguard against potential supply chain disruptions and escalating costs. Simultaneously, consumers are exhibiting a growing tendency to stockpile goods, perceiving imports as a potential hedge against domestic inflation. This convergence of behaviors has significantly amplified import volumes across various sectors.
Investment in infrastructure
Substantial investments in the United States’ infrastructure are exerting upward pressure on import volumes. The construction of roads, bridges, ports, and other critical infrastructure necessitates a vast array of raw materials, many of which are sourced from foreign markets. This heightened demand for imported commodities has become a significant driver of the nation’s import activity.
Concurrently, the pursuit of technological advancement is fueling imports of capital goods. As businesses across various sectors invest in research and development, there is a corresponding need for specialized machinery, equipment, and components often unavailable domestically. This reliance on foreign-sourced inputs has become increasingly pronounced as technological innovation accelerates.
Changes in consumer behavior
The burgeoning e-commerce industry has significantly stimulated demand for direct-to-consumer imports. As online platforms democratize access to global markets, consumers are increasingly drawn to a wider array of products. This heightened interest in unique and high-quality goods from abroad has propelled import volumes to new heights.
Furthermore, the convenience and personalized shopping experiences offered by e-commerce have fostered a culture of consumption where consumers are more willing to explore international options. As a result, the demand for imported products has expanded beyond traditional retail channels, solidifying its position as a key driver of global trade.
Comparison of leading ports for container imports
Market share disparities between ports
The market share of container imports at West Coast ports grew compared to June, while East Coast and Gulf ports experienced no significant change. A comparison of the top 5 ports on each coast from June to July 2024 reveals a slight decline in the combined market share of the top 5 East Coast and Gulf ports to 41.3% (down 0.1%), while the top 5 West Coast ports saw a slight increase to 45.5% (up 0.9%). The top 10 ports collectively increased their market share to 86.8% in June 2024, up 0.7% from the previous month.
Changes in cargo transportation speed
Despite a record-breaking TEU volume that strained port and inland logistics operations in July, the total cargo shipping delay time at the top 10 ports decreased compared to June. While both West Coast and East Coast ports experienced varying levels of delays, the Port of Charleston on the East Coast saw the most significant improvement with a 2.9-day reduction in delay time. Conversely, the Port of Tacoma on the West Coast reported the largest increase in delays, with a 1-day extension compared to June.
The Panama Canal’s impact on US inbound trade
Recent rainfall has restored the Panama Canal to near-full operating depth. Gatun Lake has reached 84.4 feet, allowing approximately 36 vessels to transit the canal daily starting in September.
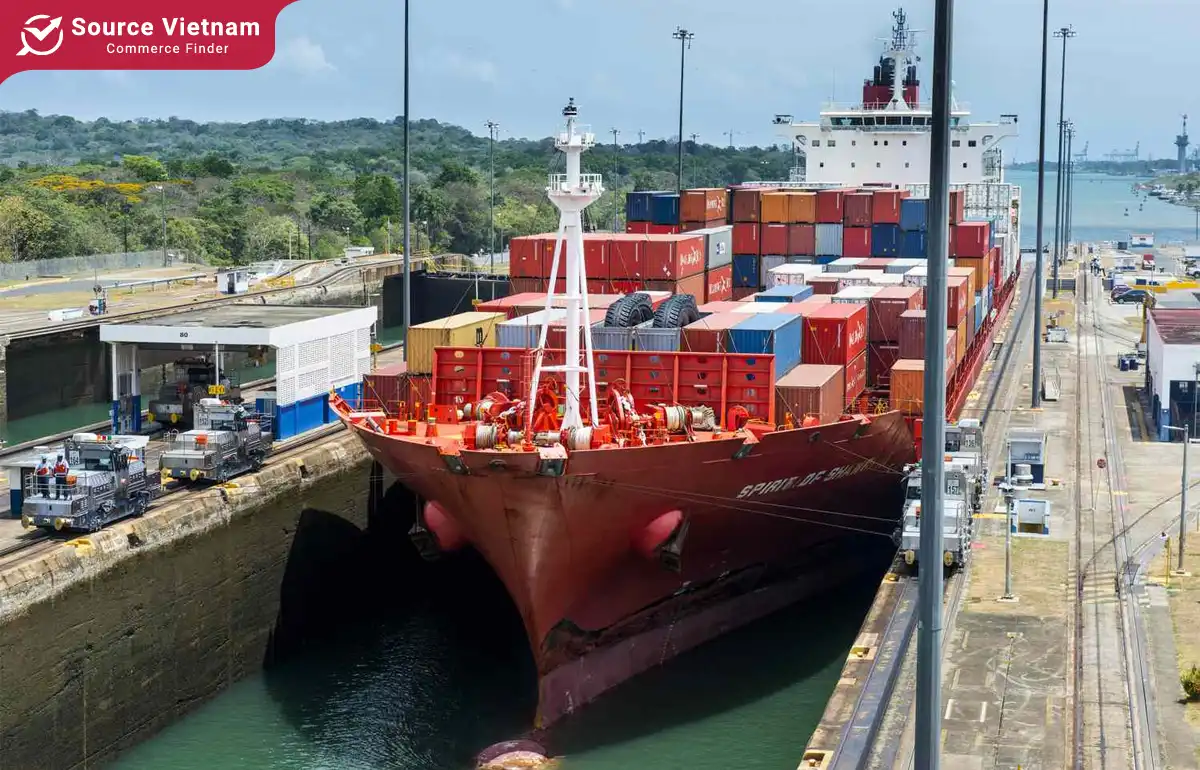
This improvement follows last year’s severe drought caused by El Niño, which had significantly restricted canal operations. The Panama Canal Authority anticipates water levels to further rise to 86.1 feet by October, ensuring more stable daily transit slots and reducing previous disruptions.
Additionally, import volumes at Gulf Coast ports decreased for the second consecutive month in July 2024. Compared to June, imports were down 2.3%, while port transit time at the Gulf Coast ports remained stable in July.
The container import rate in the US has reflected much about the country’s economy, trade, and manufacturing. Through these figures, we can also see Vietnam’s export potential to this country. In today’s market, SourceVietnam is one of the most comprehensive platforms supporting both buyers and sellers in the import-export process. For buyers, you can purchase wholesale products with extremely easy receiving and payment procedures. Conversely, for sellers, you can export your products to international markets more easily than ever. Contact SourceVietnam now for more advice on your import-export business journey!
Conclusion
Above is the relevant information regarding US container imports. This market is still considered a potential export market that many businesses aspire to. Don’t forget to contact SourceVietnam immediately for advice on international business solutions.


